ExIR Visualization
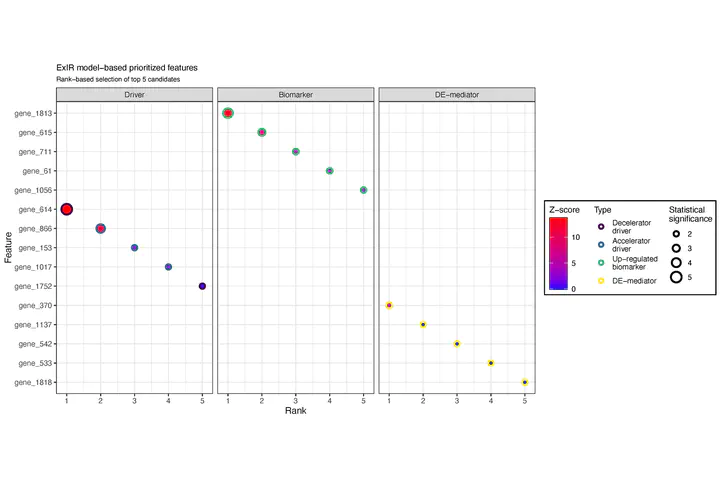 Photo by Adrian Salavaty
Overview
This function has been developed for the visualization of ExIR results. This function is available in both R and Python versions of the influential package. All of the arguments provided for the adjustment of the visual features of the figure are explained in the function descriptions. Also, the tutorial video showcases the function performance in the R environment.

Adrian Salavaty
Senior Bioinformatician
Senior Cancer Scientist
Bioinformatician and systems biologist developing computational methods for single-cell, spatial and multi-omics cancer research.